Access required
This case study is password protected. To view it, please enter the password below.
To request access, please contact claremnguyen@gmail.com
Performance Reports & Training AI Chatbots
Users could train their AI chatbots, but couldn't see whether it was working or prove its value to stakeholders.
I redesigned the AI responses testing page to show acceptance rates by category, and designed two performance reports that compare AI and non-AI chatbots and reveal what site visitors are asking about.

Drift / Salesloft
Clare Nguyen, Bionic Team, Signals & Insights Team
Product designer
Competitive analysis, usability testing, prototyping, UI design, UX design, UX writing, wireframing, interviewing, surveying
January 2025 - October 2025
Background
Drift introduced its first iteration of generative AI chatbots (also referred to as the “AI response node” or “Bionic chatbots”) in 2023. By including the AI responses node within users’ Playbooks, users were able to save over 60 hours on Playbook design by more than 43%.
While generative AI has been a huge game changer, it has never been "perfect," and our customers were left with two big questions: Is my AI chatbot actually getting better? And is it worth it?
Across two projects, I set out to answer both.
Results
Surfacing historical inquiries and acceptance rates on the AI responses testing page gave customers visibility into their training efforts, and every user I tested with correctly understood how the acceptance rate was calculated.
The testing page is now used daily by customers, CSMs, and consultants to train and improve their AI chatbots.
The performance reports have been well received by customers, and sharing designs early helped strengthen the relationship between the product team and our CSMs and consultants.


Problem
From my user research, I discovered a common thread: customers didn't understand (and, as a result, didn't trust) our AI.
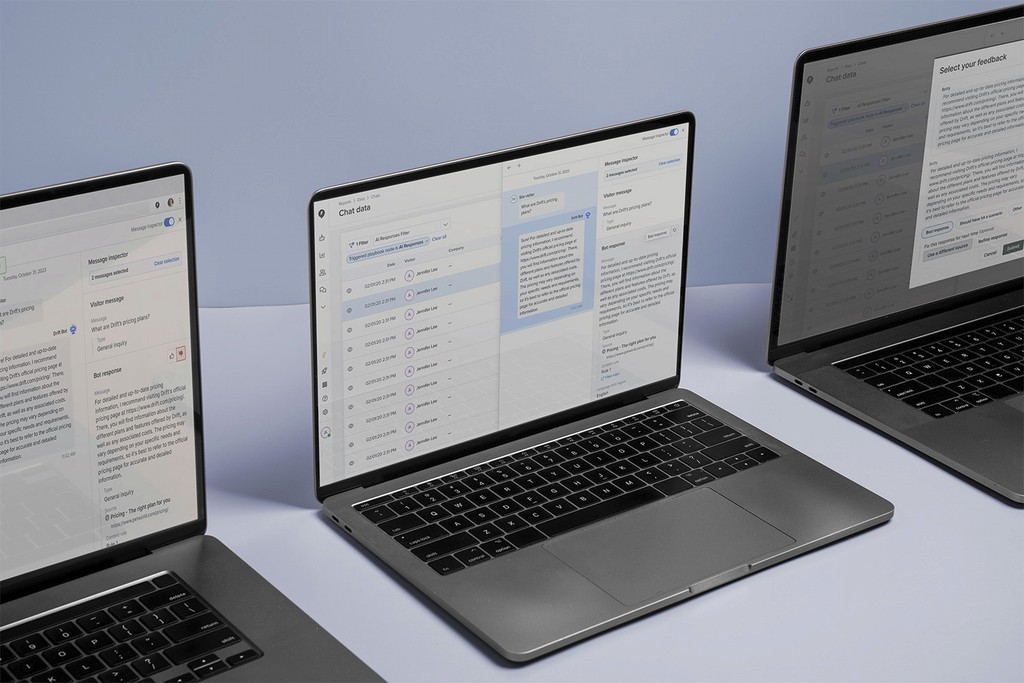
To improve their bots' accuracy, users could train them on the AI responses testing page. They understood that providing feedback did something. Or… at least they hoped it did. But the page showed no sign of success or improvement, so it did nothing to draw back the curtain on the mystery of AI.
Proving value was just as hard. If users wanted to know how many meetings were booked or what their conversations included, they had to go into the Chat data report and view each conversation one by one. Some of this data was already tracked, but only our CSMs and consultants could access it in Google Looker. Customers struggled to explain to their stakeholders how Drift was benefiting them, and they needed something fast.
Solution: Part 1 - Training AI chatbots
Surfacing historical data
After a quick discussion with Engineering, I found out that we had (thankfully) been storing every test inquiry customers sent to the testing page. All we really needed to do was surface it. Woohoo! Because space was limited, I used selection tiles, quick filter chips, and categories to make the inquiries easy to skim. Users now had something to work with as soon as they visited the page.
Exposing strengths and weaknesses
On a macro level, I showed the overall acceptance rate (accepted inquiries divided by total inquiries) as a quick snapshot of the bot's accuracy. On a micro level, I added the acceptance rate for each category, so users could skim and see exactly where their efforts needed to go.
Testing
In user testing with CSMs, consultants, and customers, everyone correctly worked out how the acceptance rate was calculated, and re-testing inquiries was straightforward. One surprise was that testers worried their feedback on one inquiry would affect the next, unrelated one. That wasn't how it worked in the backend, but it showed me we hadn't made that clear enough in the UI.
Solution: Part 2 - Performance reports
In June 2025, I joined a new team, Signals & Insights, to bring this data directly to our customers. I split the work into two reports: an AI overview to prove value, and Conversation insights to show what site visitors were actually talking about.
AI overview: Comparing AI to non-AI
To help users compare their AI and non-AI chatbots, I carried over the KPI cards from the Chat playbooks report (chats, emails captured, meetings booked, and visitor sentiment). I also added a new card for chats routed. CSMs and consultants kept telling me that customers wanted to see how often their AI resolved inquiries without pulling in a live rep, because that's where the time and money savings are.
AI overview: Visualizing business impact
To show what these metrics led to, I added a conversion funnel of opportunities sourced and influenced by AI conversations, for customers integrated with Salesforce. I also used a sankey graph to map the buyer's journey, from the first question, to qualification, to booking a meeting or abandoning the chat. Unlike linear non-AI conversations, AI conversations can go in almost any direction. I worked with Engineering on ways to keep the graph scalable as it grows.
Conversation insights: Classifying questions and keywords
Instead of reading conversations one by one, users could see which categories their visitors' inquiries fell into, how those categories trended over time, and how each performed based on their training feedback. A separate tab got into the nitty gritty. It had a donut chart of the most mentioned keywords and a table ranking keywords against the previous period. Customers could finally see what visitors were asking about, down to a specific product or webinar.


Bridging relationships
At Drift, CSMs and consultants had long felt left out of the product process. On both projects, I posted my designs in their Slack channels and offered to walk them through my thinking. I was upfront when a request was planned for a future iteration, and when a request was small enough, I added it right away. Their feedback was so, so helpful, and they connected me with customers who were excited to see what we were building.
Something that felt like the bare minimum did wonders for how they felt about the product team.


Future vision
Both projects surface a lot of insight. The next step is helping customers act on it.
For the reports, I envision AI recommendations that tell users what content is missing from their Content library, create custom categories, and prompt them to train specific categories.
For training, customers currently jump between two places: the testing page, which only handles test data, and the Chat data report, which handles real data but only one conversation at a time. My goal is to turn Preview mode, where users test Drift's autonomous Chat agent, into one central hub for testing and training. It would support both Playbooks and Chat agent, content segmentation rules, and different audiences.


Conclusion
The whole project was quite chaotic, but I don't know if there was anything I would have done differently. The entire team was flying by the seat of our pants and for a majority of the project, I had to design on the fly. I was learning about Vertex at the same time the engineers were.
I will say that the team worked exceptionally well together and I'm proud of our collaborative efforts. Everyone (not just the trio!) worked hard to make this happen and every time we hit a snag, we all rolled with the punches.
Overall, I'm quite pleased with how this turned out. Our customers have been incredibly happy with the migration and we've now set our focus on bringing back the features we had before.